Lancaster County's median sold price hit $385,000 in June 2026, a new record, and held there through July, according to Bright MLS data reported by the Lancaster County Association of Realtors. That's the number showing up in headlines. It's also the number a buyer scrolling listings in Lancaster city will find almost useless, because inside the city limits, that single figure breaks apart into at least eight distinct markets, some selling for under $200,000 and others clearing half a million, often separated by a few blocks and a shared bus route.
This isn't a story about whether Lancaster is affordable. It's a story about what the word "Lancaster" is actually hiding when a portal or a headline flattens it into one number.
The record number, and what it's actually measuring
The county-level statistics are solid and worth taking seriously. July 2026 brought 566 new listings, up 13.4% from a year earlier and 4% higher than June. Homes moved fast, averaging 16 days on market, down from 20 days in June and just a shade above the five-year July average of 15 days. Closed sales came in at 471, nearly identical to the 473 closed in July 2025, while pending sales rose 2.2% year over year.
Christina Diehl, president of the Lancaster County Association of Realtors, put it plainly when the July figures came out: "Market conditions can vary by neighborhood and price range." That line does more work than the record-price headline it accompanied.
It's also worth knowing that different data sources measure Lancaster differently, which is why you'll see the same market described with medians anywhere from the mid-$200,000s to the high $300,000s depending on whether the source is tracking the county, the city, a rolling six-month window, or current asking prices instead of closed sales. None of those numbers are wrong. They're answering different questions. The LCAR figure of $385,000 covers the whole county and closed transactions. The moment you narrow the lens to city neighborhoods, the picture changes entirely.
What "Lancaster" actually means once you're inside the city
Lancaster city isn't one market wearing one price tag. It's a patchwork of named neighborhoods, each with its own housing stock, its own pace, and its own price band. Here's roughly what that looks like based on current neighborhood-level data:
| Neighborhood | Typical Price Range (2026) | Housing Stock |
|---|---|---|
| Stevens | Around $167,000 | Modest single-family and rowhome stock |
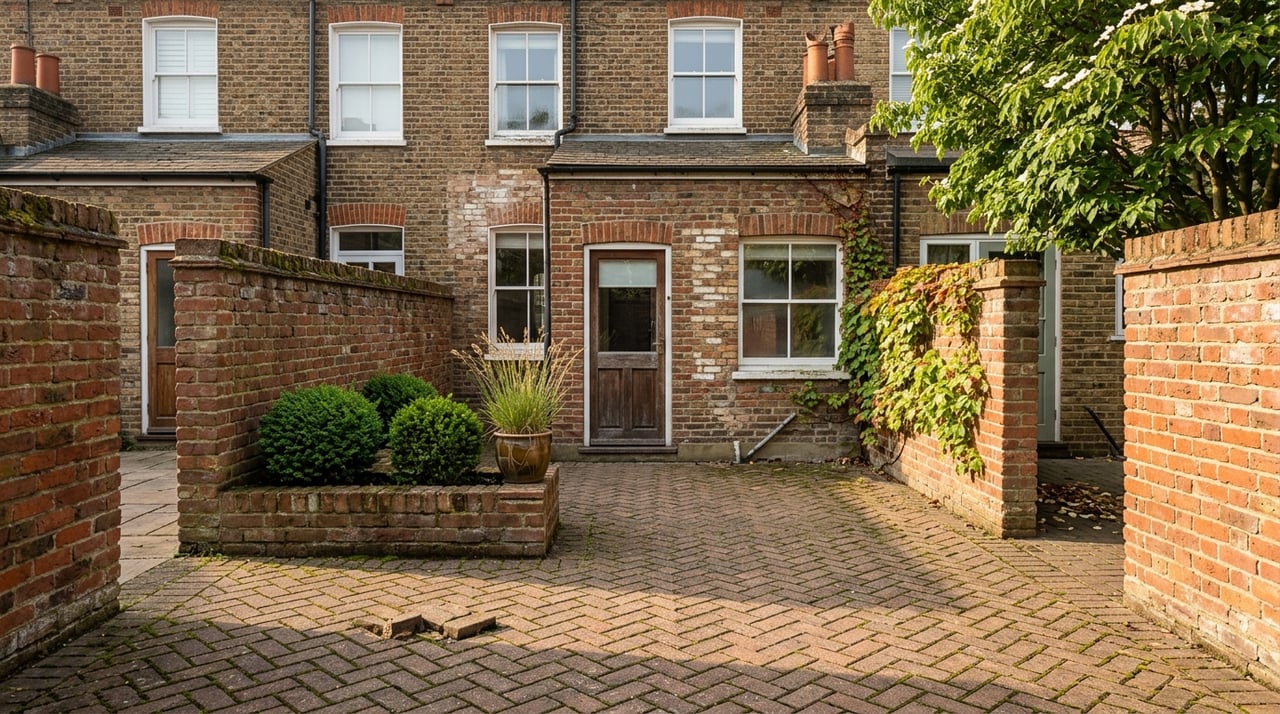
| Mussertown | Around $171,000 | Historic rowhomes, transitioning through renovation |
| Cabbage Hill | Roughly $215,000, most 2-3 bedroom homes between $130,000 and $220,000 | 1940s rowhouses, Cape Cods, and newer townhouses side by side |
| Churchtowne | $150,000 to $230,000 for rowhomes, up to $300,000 renovated | Colorful rowhomes, active revitalization investment |
| Musser Park | Around $282,500 typical value, asking prices reaching into the $700,000s | Historic 19th-century homes near the park |
| Chestnut Hill | Around $399,000 median asking price as of August 2026, detached historic homes from $450,000 to $800,000+ | Tree-lined streets, brick homes, mid-century mixed in |
| College Park | Around $506,000 | Larger homes near the college corridor |
That's a spread of roughly $339,000 from the low end to the high end, inside a city where you could walk between the cheapest and most expensive of these neighborhoods in under half an hour. A buyer who anchors their expectations to the countywide $385,000 median could walk into Cabbage Hill and think they're getting a steal, or walk into College Park and assume they're being overcharged. Neither read would be accurate. They'd just be comparing the wrong number.
Why the gap exists, and why it isn't about distance from downtown
Here's the part that surprises people. The spread doesn't track cleanly with how close a neighborhood sits to downtown Lancaster. Cabbage Hill and Chestnut Hill are both a short walk from the city's center, and yet their price bands don't overlap. The difference comes down to what's actually standing on the lot: era of construction, lot configuration, and how much renovation has already happened.
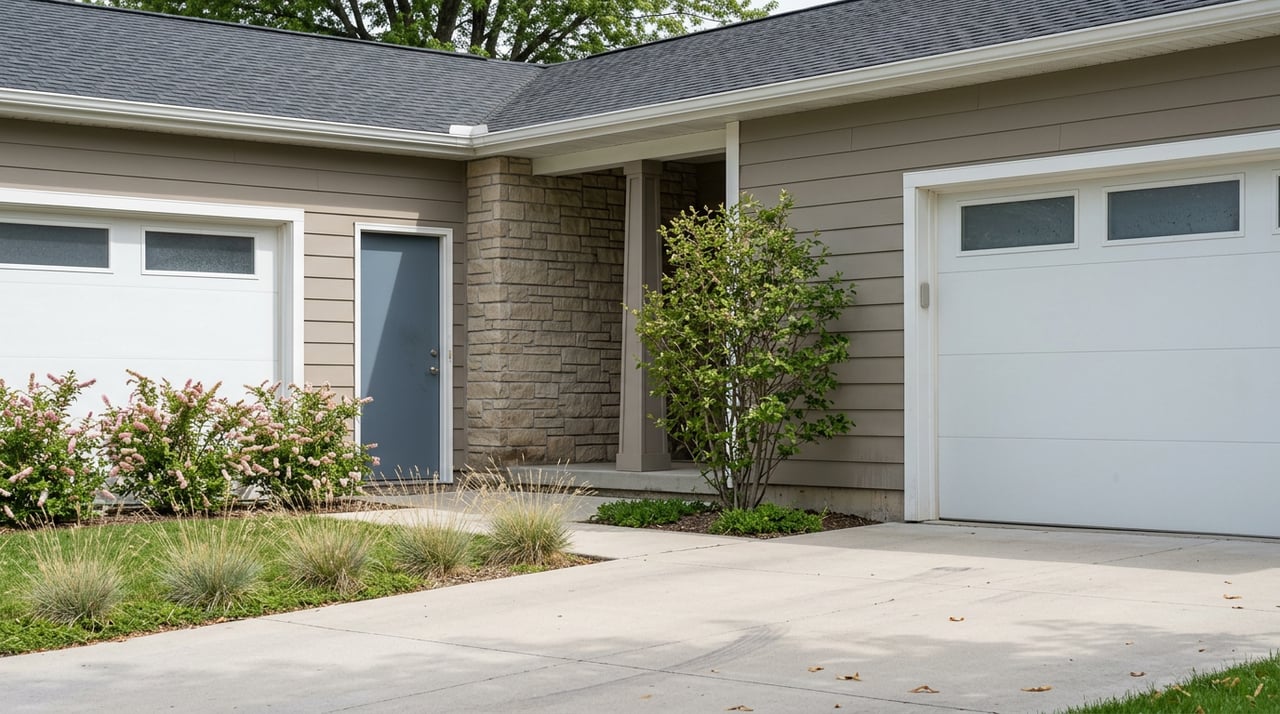
Cabbage Hill is a mix of 1940s rowhouses, Cape Cod-style homes, and newer townhouses packed tightly together with on-street parking and narrow setbacks. Values there have stayed comparatively flat for years, even as the county median climbed. Homes have still moved quickly, typically selling in about 31 days, faster than the national average of 58 days. This isn't a stagnant corner of the market. It's a differently priced one, with steady demand and a ceiling that hasn't moved much.
Chestnut Hill, a few blocks over, carries larger detached historic homes alongside townhomes, sits closer to Buchanan Park and Beau's Dream Dog Park, and backs up toward Gallery Row and the Fulton Theatre. The housing stock itself, not the address, is doing most of the work on price.
Even within a single neighborhood, the same pattern repeats at a smaller scale. Musser Park's typical value sits around $282,500, but asking prices there stretch as high as $750,000 for the largest historic homes near the park. The lesson holds at every zoom level: age, size, and condition of the building move the number far more than which side of downtown it sits on.
A few of the fixed points that give these neighborhoods their character, worth knowing if you're comparing them in person rather than on a spreadsheet:
- Buchanan Park and Beau's Dream Dog Park, bordering Chestnut Hill
- The North Museum of Nature and Science, adjacent to Buchanan Park
- Fulton Theatre on Gallery Row, one of the oldest operating theaters in the country
- Clipper Magazine Stadium, home to the Lancaster Stormers, near the Stadium District
- Weis Markets and the Regal Manor movie theater, serving the Cabbage Hill area
What this means if you're actually comparing neighborhoods right now
If you're deciding between two Lancaster city neighborhoods, the countywide median is close to irrelevant to that decision. What matters is comparing closed sales within the specific neighborhood you're considering, not the city or county average, and understanding what's driving the price you're seeing: is it the lot, the renovation history, or genuine scarcity of that housing type.
It also means days on market can mislead you the same way price does. A neighborhood moving fast at a low price point, like Cabbage Hill's roughly 31-day average, isn't evidence of a weak market. It's evidence of a different market, one with its own steady base of buyers who know exactly what they're getting.
If you're selling in one of these neighborhoods, the countywide record price is good news for the market broadly, but it's not your pricing benchmark. Your comps are the handful of recent closed sales on your own streets, not the number making headlines.
A few questions worth asking before you compare neighborhoods
Does a lower median mean lower quality? Not necessarily. Cabbage Hill's price band reflects smaller lots and older rowhouse construction, not a judgment on the neighborhood itself. Fast sales there suggest steady, consistent demand.
Is the countywide record price likely to keep climbing? July's data showed prices holding at the June record rather than climbing further, alongside a meaningful jump in new listings. More inventory arriving at a steady price point suggests a market finding its footing rather than accelerating.
How do I fairly compare two Lancaster neighborhoods? Look at closed sales in each neighborhood over the same recent window, not asking prices, and account for housing stock differences like lot size and renovation status before comparing price per square foot.
Talk it through with someone who knows these blocks
A countywide median tells you where the market has been. It won't tell you what a specific street in Chestnut Hill or Cabbage Hill is actually worth this month. If you're weighing neighborhoods in Lancaster, or trying to price a home correctly within one, Denise Bollard can walk you through the closed comps that actually apply to your situation. Schedule a consultation and get a read on the market that goes block by block instead of county-wide.